***
title: Enterprise Edge observability
'og:site\_name': Unleash Documentation
'og:title': Enterprise Edge observability - Monitor health and performance of Edge nodes
description: >-
Enterprise Edge observability provides deep visibility into the health and
performance of your Unleash Edge nodes directly within the Admin UI.
keywords: 'edge observability, monitoring, performance, metrics, health'
max-toc-depth: 3
----------------
[Enterprise Edge](/unleash-edge) observability provides deep visibility into the health and performance of your Unleash Edge nodes directly within the Admin UI.
This feature enables you to monitor the real-time state of every connected Edge instance, helping you identify bottlenecks, verify regional deployments, and ensure your Edge nodes are properly synced.
## View your Edge observability dashboard
To access the Enterprise Edge observability dashboard, go to **Admin settings > Enterprise Edge** in the Unleash Admin UI.
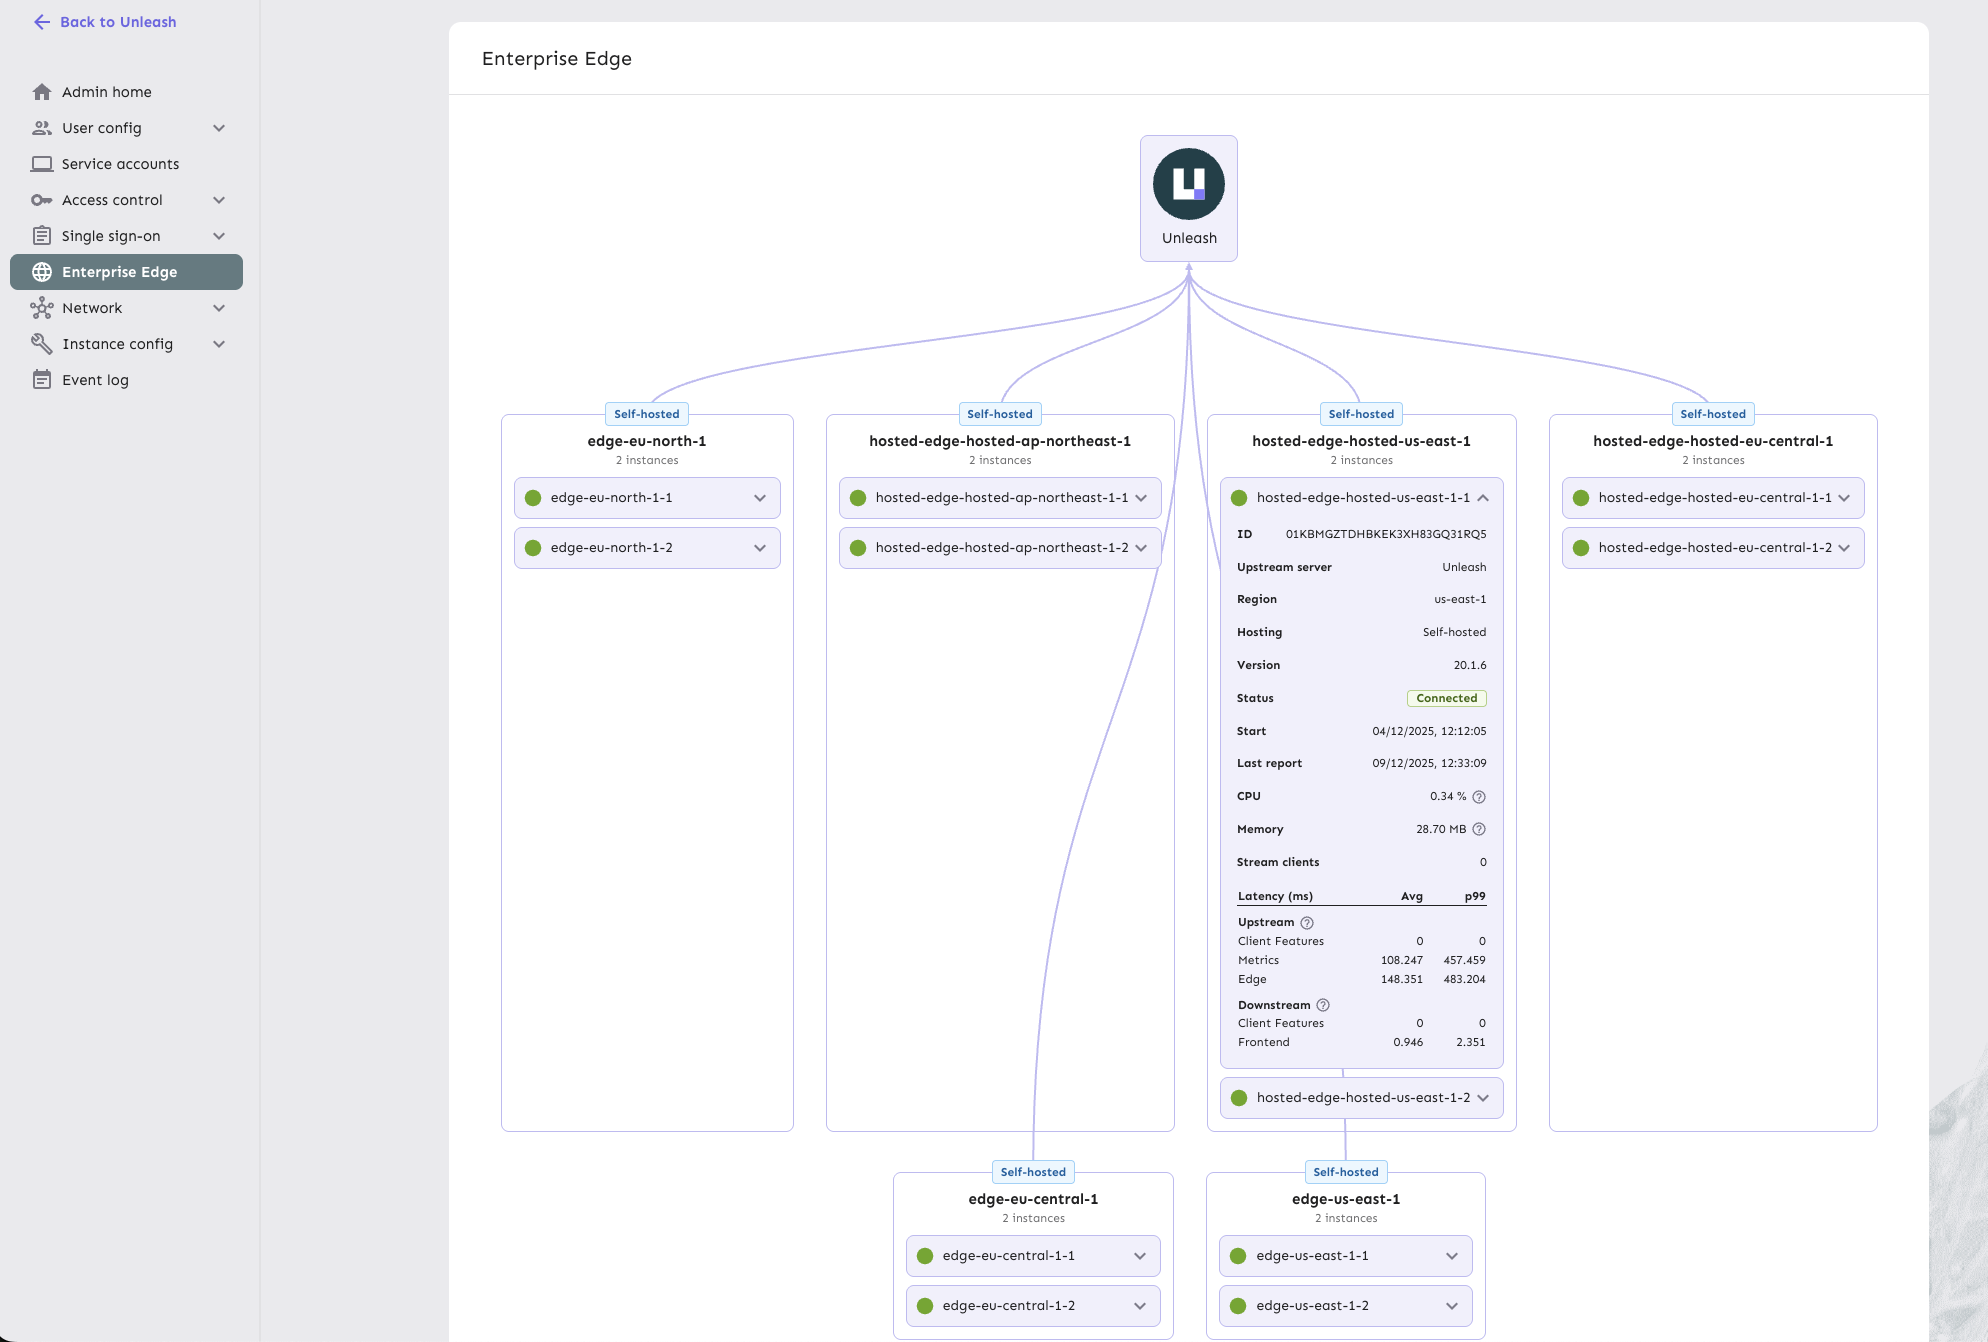
## Metrics and information
The dashboard reports the following metrics for each Edge node:
### Instance details
* **Region**: The hosting region where the Edge instance is deployed.
* **Instance ID**: Unique identifier for the Edge instance.
* **Upstream server**: Whether the instance connects to Unleash or another Edge node.
* **Hosting type**: Whether the instance is hosted (managed by Unleash) or [self-hosted](/unleash-edge/deploy) (managed by you).
### Instance health
* **Status**: Current connection state (for example, `Connected`) with start time and last reported connection.
* **Version**: The running version of the Edge binary.
* **Resources**: Real-time CPU and memory usage.
### Traffic and performance
* **Stream clients**: Number of SDKs currently maintaining a streaming connection to this Edge instance.
* **Upstream latency**: Time taken to fetch updates from the upstream Unleash server, broken down by:
* Client Features
* Metrics
* Edge sync
* **Downstream latency**: Time taken to serve requests to connected SDKs, broken down by:
* Frontend evaluations
* Backend evaluations
These metrics help you identify performance bottlenecks, verify that your Edge nodes are properly distributed across regions, and ensure that configuration updates are being synced efficiently.