***
title: Impact metrics
'og:site\_name': Unleash Documentation
'og:title': Impact metrics - Track application-level time-series metrics in Unleash
description: >-
Impact metrics are lightweight, application-level time-series metrics stored
and visualized directly inside Unleash. They allow you to connect specific
application data to your feature flags and release plans.
keywords: 'impact metrics, release automation, safeguards, counters, gauges, histograms'
max-toc-depth: 3
----------------
Impact metrics and automated release progression are early access features. Functionality may change. We are actively looking for feedback. Share your experience in the Unleash community Slack or email [beta@getunleash.io](mailto:beta@getunleash.io).
During this early access period, Impact Metrics are available for Unleash Hosted customers.
## Overview
Impact metrics are lightweight, application-level time-series metrics stored and visualized directly inside Unleash.
They allow you to connect specific application data, such as request counts, error rates, or memory usage, to your feature flags and release plans.
Use impact metrics to validate feature impact and automate your release process. For example, you can monitor usage patterns or performance to see if a feature is meeting its goals.
By combining impact metrics with [release templates](/concepts/release-templates), you can reduce manual release operations.
Unleash can monitor your rollout and automatically progress to the next milestone or trigger safeguards that pause the release based on the health of your metrics.
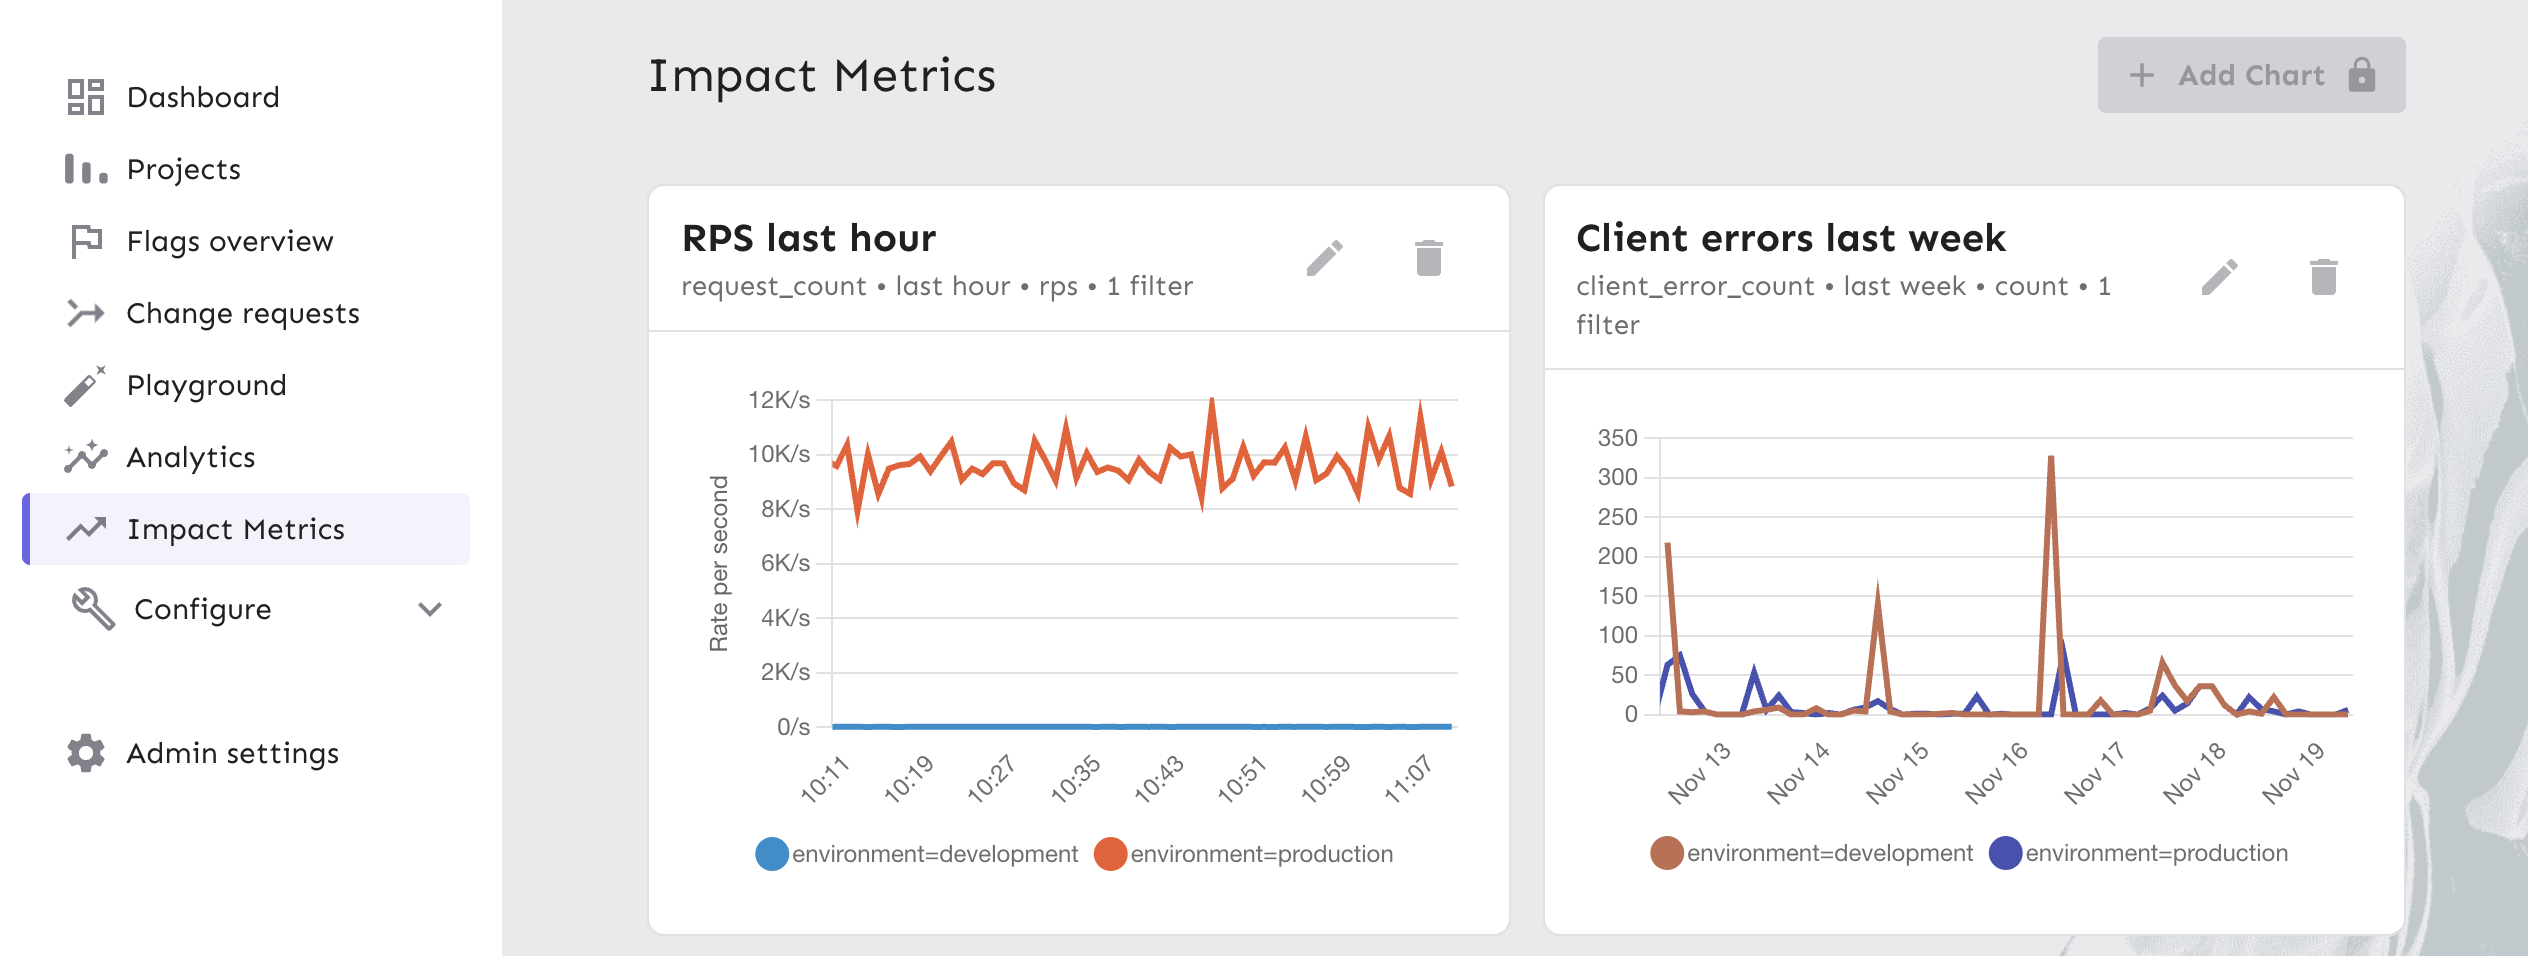
Impact metrics support three types of data:
* **Counters**: Cumulative values that only increase. These are suitable for request counts, error counts, or event counters.
* **Gauges**: Values that fluctuate up or down, such as memory usage or the number of active users.
* **Histograms**: Distribution of values, useful for measuring things like request duration or response size. Supports percentiles (p50, p95, p99).
You can use these metrics in two primary areas:
* **Charts**: Visualize data in the Impact Metrics section of the Admin UI.
* **Release management**: Drive automatic milestone progression or trigger safeguards to stop a rollout.
## Key use cases
Impact metrics provide real-time data about your features. This enables two primary workflows: [automated releases with safeguards](#automated-releases-with-safeguards) and [feature impact validation](#validate-feature-impact-and-improve-iteratively).
### Automated releases with safeguards
Impact metrics integrate directly with release templates so Unleash can automatically progress milestones or pause a rollout when metrics fall outside your defined thresholds. This reduces the manual effort required during releases, especially when teams are shipping more frequently or outside working hours.
Instead of tracking dashboards or waiting for alerts, you can use counters, gauges, or histograms to define what "healthy" looks like and let Unleash manage the rollout based on objective data.
Examples:
* Progress from 25% → 50% only if error rates remain below a threshold.
* Automatically pause when request latency increases during a rollout.
See [Automate release progression](#automate-release-progression) and [Configure safeguards](#configure-safeguards) for more information.
### Validate feature impact and improve iteratively
Beyond automation, impact metrics help you understand whether the features you build are actually solving the right problems. You can track usage patterns, performance trends, or flag-correlated outcomes over time to evaluate whether a feature is meeting expectations. This supports both short-term decisions during a rollout and longer-term decisions about iteration, refinement, or deprecation.
Examples:
* Track whether a new feature is being used as expected after rollout.
* Monitor error counts, traffic patterns, or operational health for a feature or its variants.
* Identify features that need follow-up work, optimisation, or removal.
See [Create impact metrics charts](#create-impact-metrics-charts) for more information.
## Define and record metrics in the SDK
Impact metrics are currently supported in a [select number of SDKs](/sdks#metrics-and-impression-data). To request support for additional SDKs, please contact [beta@getunleash.io](mailto:beta@getunleash.io).
To visualize a metric in Unleash, you must first define the metric in the SDK and then count or record values for it.
The SDK automatically attaches the following context labels to your metrics to ensure they are queryable in the UI: `appName`, `environment`, `origin` (for example, `origin=sdk` or `origin=Edge`).
### Counters
Use counters for cumulative values that only increase, such as the total number of requests or errors.
```javascript
// 1. Define the counter
unleash.impactMetrics.defineCounter(
'request_count',
'Total number of HTTP requests processed'
);
// 2. Increment the counter
unleash.impactMetrics.incrementCounter('request_count');
```
### Gauges
Use gauges for values that can go up and down, such as current memory usage or active thread count.
```javascript
// 1. Define the gauge
unleash.impactMetrics.defineGauge(
'heap_memory_total',
'Current heap memory usage in bytes'
);
// 2. Update the gauge value
const currentHeap = process.memoryUsage().heapUsed;
unleash.impactMetrics.updateGauge('heap_memory_total', currentHeap);
```
### Histograms
Use histograms to measure the distribution of values, such as request duration or response size. Unleash automatically calculates percentiles (p50, p95, p99).
```javascript
// 1. Define the histogram
unleash.impactMetrics.defineHistogram(
'request_time_ms',
'Time taken to process a request in milliseconds'
);
// 2. Record a value
const duration = 125;
unleash.impactMetrics.observeHistogram('request_time_ms', duration);
```
## Create impact metrics charts
You can visualize your defined metrics in the Unleash Admin UI.
1. Go to **Impact Metrics** in the sidebar.
2. Click **New Chart**.
3. In the **Add New Chart** dialog, configure the following:
* Data series: Select your counter or gauge (for example, `request_count`).
* Time: Select a window (for example, Last 24 hours).
* Mode (aggregation type): Choose how to display the data.
* For Counters:
* Rate per second
* Count
* For Gauges:
* Sum
* Average
* For Histograms:
* p50
* p95
* p99
* Filters: Optionally filter by `appName`, `environment`, `origin`.
4. Click **Add chart**.
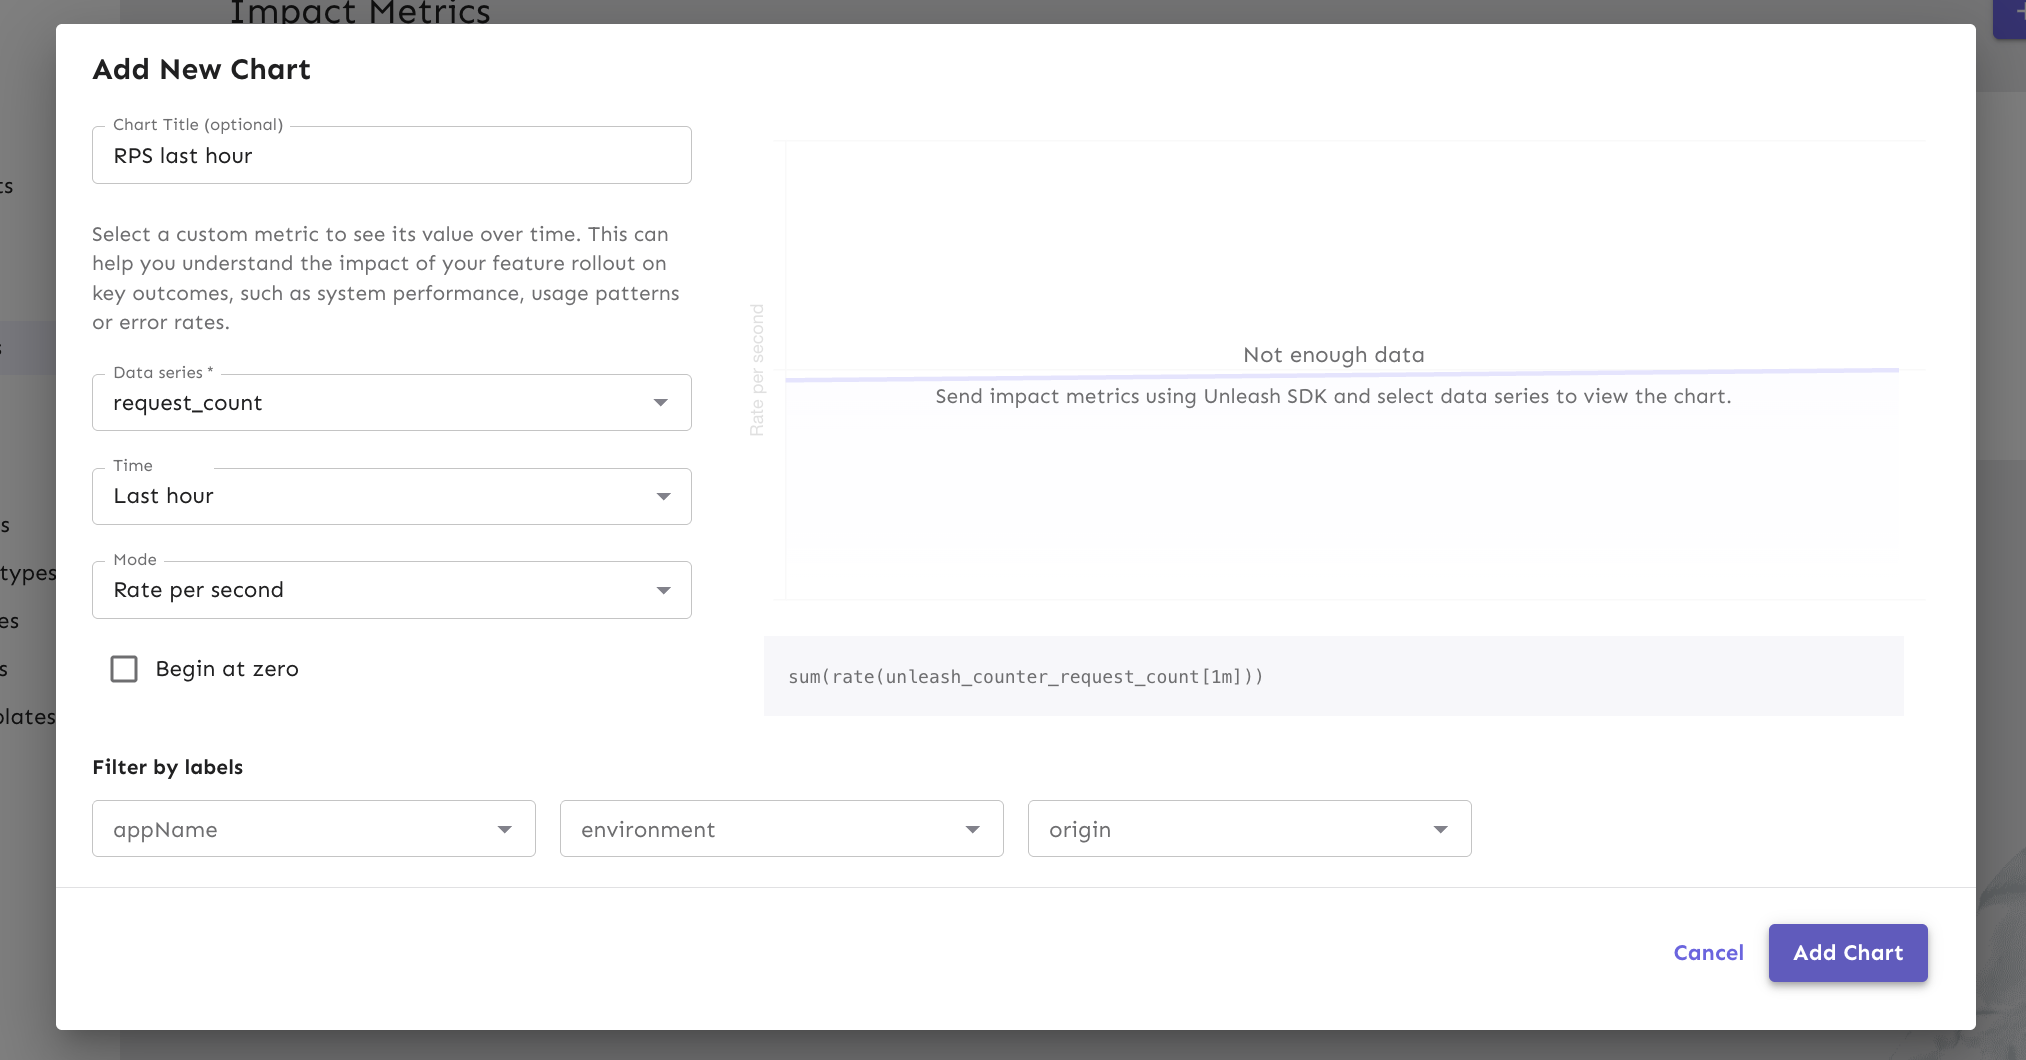
The chart will display the data based on your configuration. Note that there is a 1–2 minute delay between data generation and visualization due to the scrape and ingestion cycle.
## Automate release progression
Impact metrics integrate with [release templates](/concepts/release-templates) to automate the rollout process. Instead of manually updating milestones (for example, moving from 10% to 50%), Unleash can handle this for you.
To configure automatic progression:
1. Open a feature flag that [uses a release template](/concepts/release-templates#apply-a-release-template-to-a-feature-flag).
2. Select a milestone and click **Add automation**.
3. Define the conditions:
* Time: The minimum duration the milestone must run. For example, proceed after 24 hours.
4. Click **Save**.
When the time conditions are satisfied, Unleash automatically advances the release to the next milestone.
## Configure safeguards
Safeguards act as a safety net for your releases. They can automatically pause a rollout if metrics indicate system instability.
With metrics flowing into Unleash, you can [create a safeguard](/concepts/impact-metrics#configure-safeguards) that pauses the automated progression when something goes wrong.
First, verify your metric is available by selecting **Add safeguard** and checking that your impact metric exists in the dropdown list. It may take some time for the impact metric to appear after starting your process, because it is sent to Unleash when the client reports metrics, which happens by default on a 60s interval.
Then, add a safeguard to your release plan:
1. Select **Add safeguard** on your release plan.
2. Select your impact metric from the dropdown.
3. Configure the threshold. For example:
* Metric: `analyze_feature_error`
* Aggregated by: Count
* Condition: More than 10 in the last 15 minutes
4. Click **Save**.
When the metric exceeds the threshold, Unleash will pause the automated progression.
## Technical implementation details
### Ingestion and batching
Impact metrics are batched and sent on the same interval as [regular SDK metrics](/concepts/impression-data). They are ingested via the regular metrics endpoint.
### Unleash Edge behavior
Unleash Edge forwards impact metrics received from SDKs to the Unleash API. The origin of the label appears as `origin=Edge`. Daisy-chaining Edge instances is not supported.
If an Edge instance accumulates a large batch of metrics (e.g., due to a temporary network disconnect), it will send them as a single bulk send upon reconnection. This will appear as a large, sudden spike in your counter graphs, rather than a smooth distribution over time. This is expected behavior.