API overview
Unleash APIs
Unleash provides a set of APIs to give you full programmatic control over your feature flags and to connect your applications and services to Unleash. There are three main APIs, each designed for a specific purpose.
| API | Path | Used by | Primary use case |
|---|---|---|---|
| Client API | <your-unleash-url>/api/client | Backend SDKs | Fetch feature flag configurations. |
| Frontend API | <your-unleash-url>/api/frontend | Frontend SDKs | Fetch enabled feature flags for a specific Unleash Context. |
| Admin API | <your-unleash-url>/api/admin | Admin UI, internal tooling, and third-party integrations | Access and manage all resources within Unleash, such as context, environments, events, metrics, and users. |
API authentication and tokens
All Unleash APIs require authentication using an API token. The type of token you use depends on the API you are accessing and your specific use case.
Token types
Unleash supports four types of API tokens:
- Backend tokens: Used to connect backend SDKs, Unleash Edge, and the Unleash Proxy to the Client API. Can be scoped to a specific project and environment.
- Frontend tokens: Used to connect frontend SDKs to the Frontend API or Unleash Edge. These tokens are designed to be publicly accessible and have limited permissions. Can be scoped to a specific project and environment.
- Personal access tokens: Tied to a specific user account. They are useful for testing, debugging, or providing temporary access to tools and scripts that need to interact with the Admin API.
- Service account tokens: The recommended method for providing API access to integrations, automation tools, and other non-human users. Service accounts provide a more secure and manageable way to grant Admin API access.
For an end-to-end Unleash integration, you might need to use multiple token types. For example, when connecting a frontend SDK to Unleash using Unleash Edge, you'll need the following tokens:
- A frontend token for the frontend SDK to securely communicate with Unleash Edge.
- A backend token for Unleash Edge to communicate with the main Unleash server.
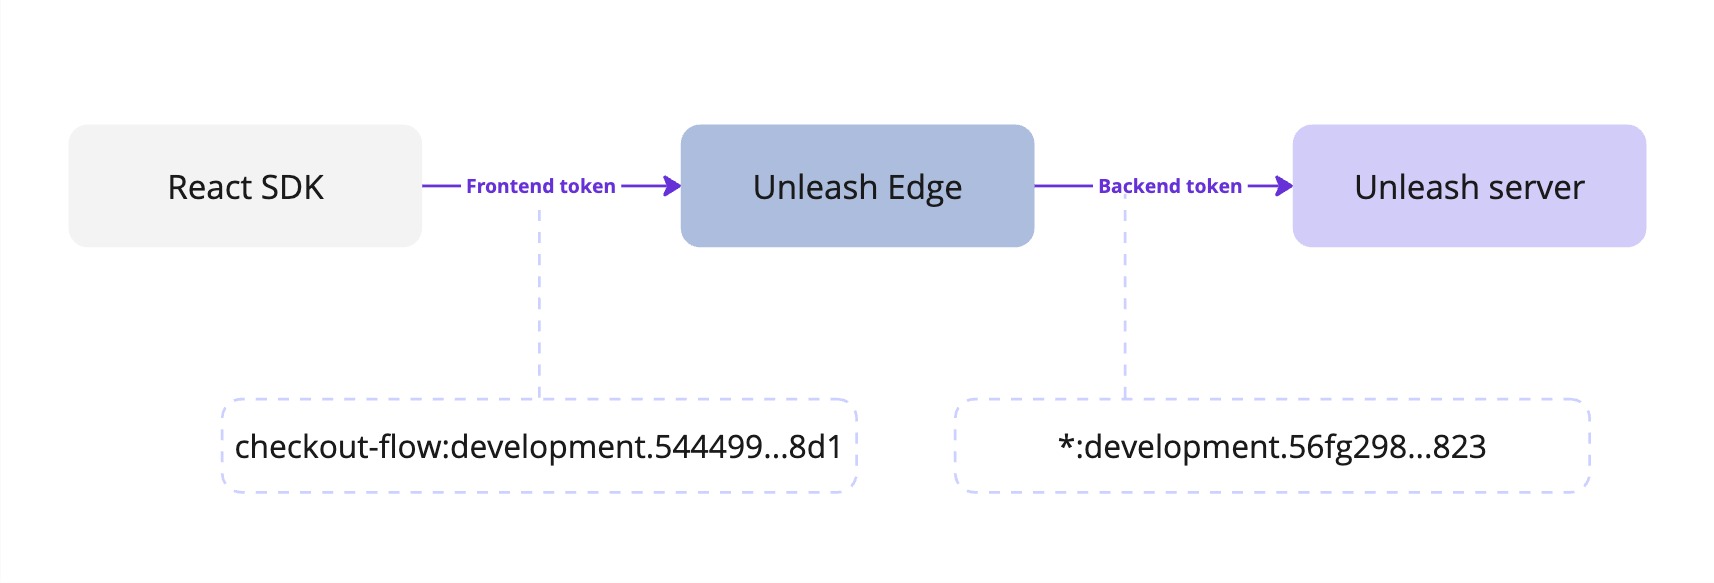
Ensure that the backend token has access to the same project and environment (or a broader scope) as the frontend token.
Create an API token
Depending on your permissions, you can create API tokens in the Unleash Admin UI in four ways:
- Admin settings > Access control > API access: for backend or frontend tokens; requires the Admin root role, or a custom root role with API token permissions.
- Admin settings > Service accounts > New service account: for creating a service account and assigning a token.
- Settings > API access [inside a project]: for project-specific client or frontend tokens; permitted for project Members or users with a corresponding root role.
- Profile > View profile settings > Personal API tokens: for personal access tokens.
API specification
For a comprehensive and interactive reference of all available endpoints, Unleash provides an OpenAPI specification. This is useful for exploring the APIs, generating client libraries, and for testing.
Unleash version: 5.2+ enabled by default.
Unleash version: 4.13+ can be enabled using the ENABLE_OAS environment variable.
You can access the specification from your Unleash instance at the following paths:
- Interactive Swagger UI:
/docs/openapi/ - Raw JSON specification:
/docs/openapi.json
For detailed guides on each API, please refer to the full reference documentation.