Enterprise Edge observability
Enterprise Edge observability provides deep visibility into the health and performance of your Unleash Edge nodes directly within the Admin UI.
This feature enables you to monitor the real-time state of every connected Edge instance, helping you identify bottlenecks, verify regional deployments, and ensure your Edge nodes are properly synced.
View your Edge observability dashboard
To access the Enterprise Edge observability dashboard, go to Admin settings > Enterprise Edge in the Unleash Admin UI.
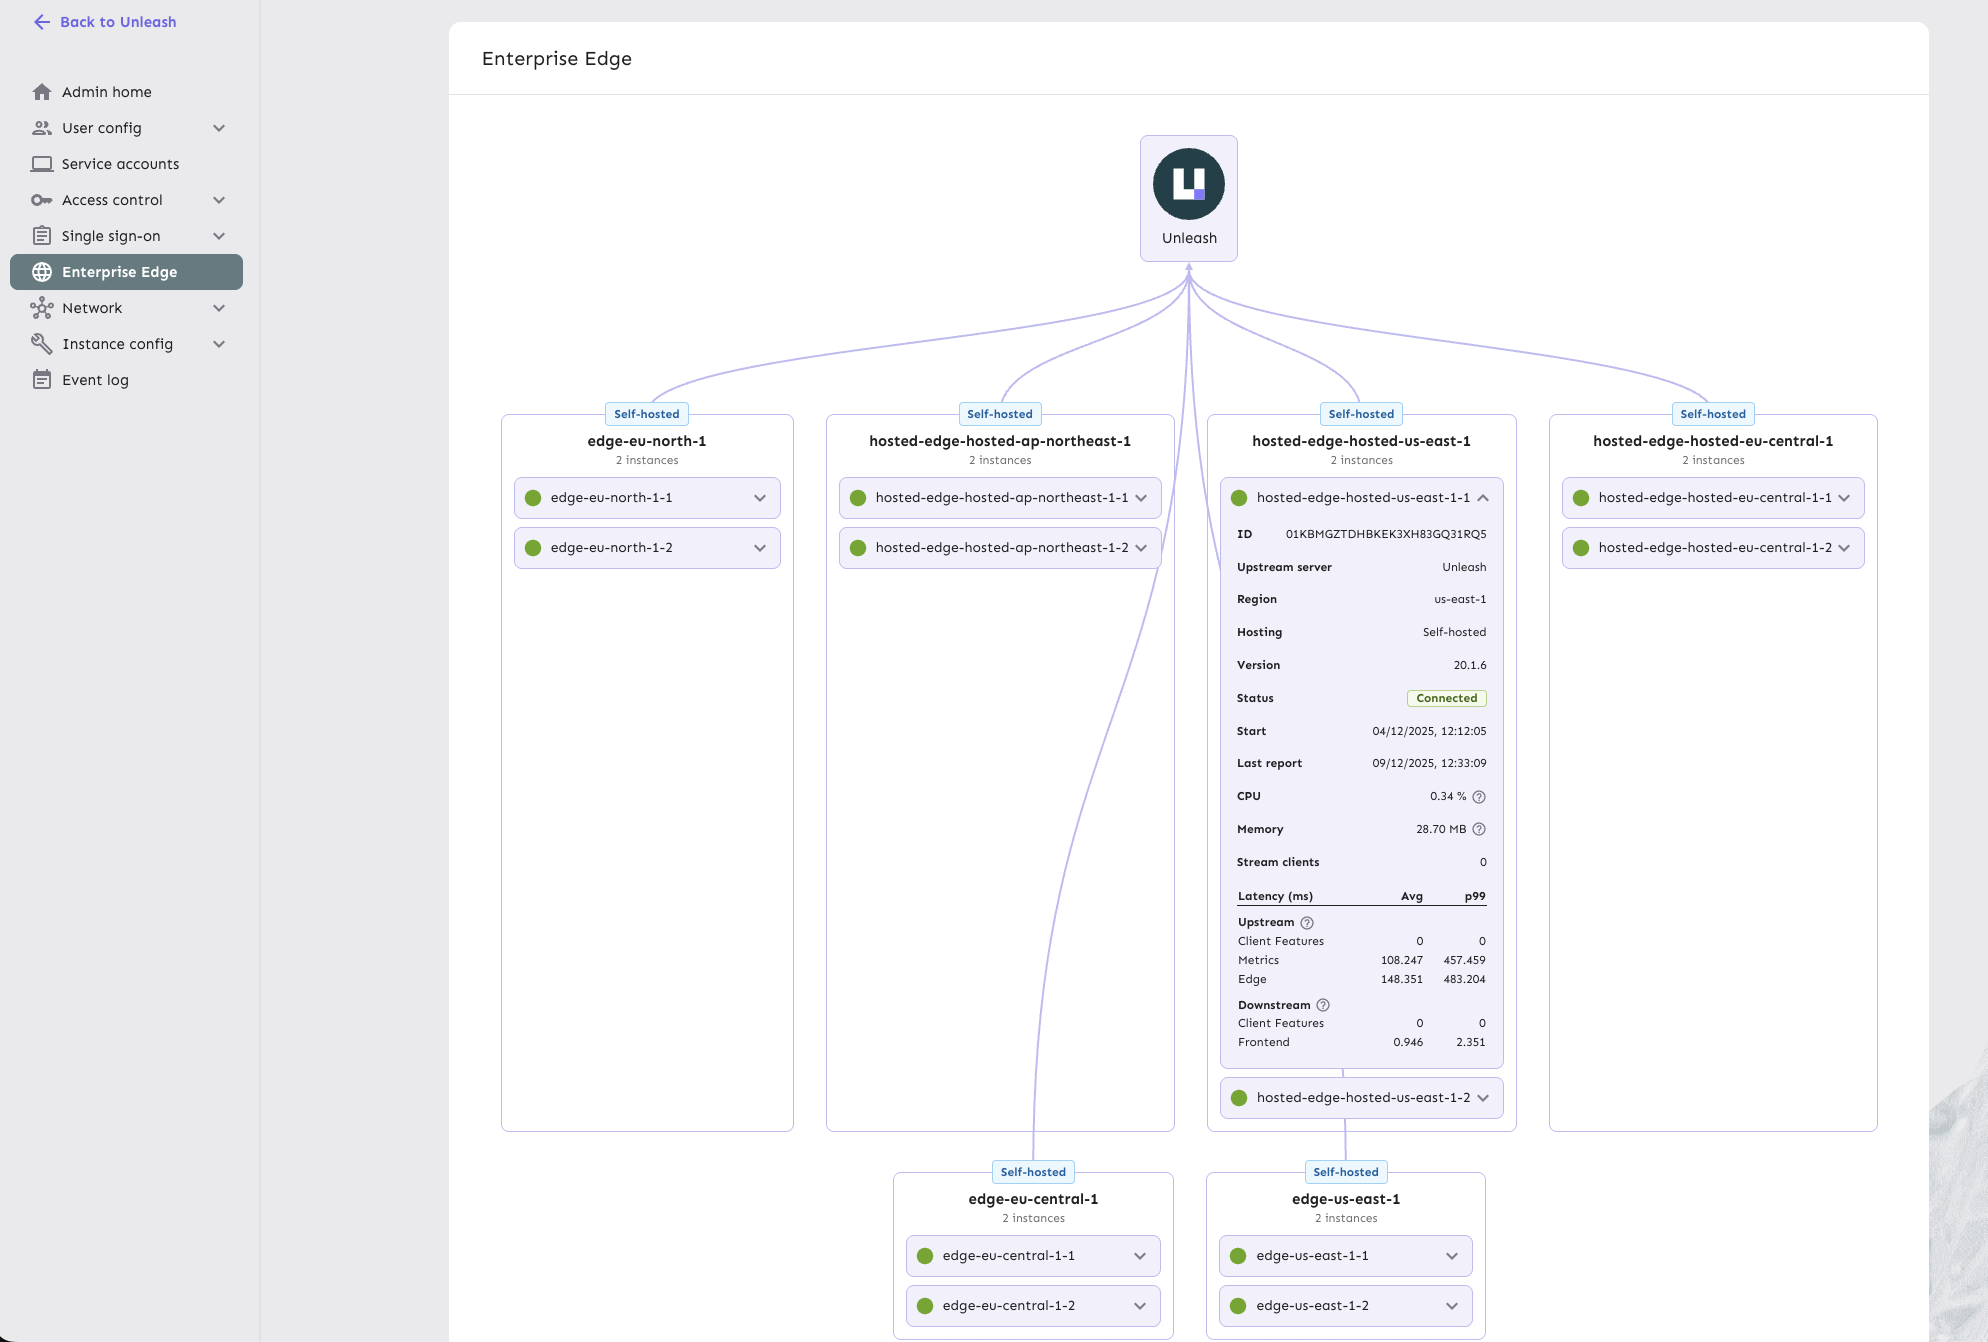
Metrics and information
The dashboard reports the following metrics for each Edge node:
Instance details
- Region: The hosting region where the Edge instance is deployed.
- Instance ID: Unique identifier for the Edge instance.
- Upstream server: Whether the instance connects to Unleash or another Edge node.
- Hosting type: Whether the instance is hosted (managed by Unleash) or self-hosted (managed by you).
Instance health
- Status: Current connection state (for example,
Connected) with start time and last reported connection. - Version: The running version of the Edge binary.
- Resources: Real-time CPU and memory usage.
Traffic and performance
- Stream clients: Number of SDKs currently maintaining a streaming connection to this Edge instance.
- Upstream latency: Time taken to fetch updates from the upstream Unleash server, broken down by:
- Client Features
- Metrics
- Edge sync
- Downstream latency: Time taken to serve requests to connected SDKs, broken down by:
- Frontend evaluations
- Backend evaluations
These metrics help you identify performance bottlenecks, verify that your Edge nodes are properly distributed across regions, and ensure that configuration updates are being synced efficiently.