Impact metrics
Overview
Impact metrics connect application data, such as request counts, error rates, or memory usage, to your feature flags and release plans.
You can use impact metrics in two areas:
- Charts: Visualize data in the Impact Metrics section of the Admin UI.
- Release management: Automate milestone progression or trigger safeguards that pause rollouts or disable environments when metrics cross a threshold.
By combining impact metrics with release templates, you can automate milestone progression and react automatically when metrics cross defined thresholds. For example:
- Progress from 25% to 50% only if error rates stay below a threshold.
- Pause automatically when request latency increases during a rollout.
- Disable the environment if error counts spike past a critical level.
For more use cases and how impact metrics fit into the broader release workflow, see Release management overview.
Metric sources
Unleash supports two metric sources: internal and external. Both support the same metric types and can be used in charts and safeguards.
Internal metrics
Internal metrics are defined and recorded in your application using an Unleash SDK. The SDK sends metrics to Unleash, where they are stored and queried. See Record internal metrics for setup instructions.
External metrics
External metrics are queried at read time from your existing Prometheus or VictoriaMetrics instance. The data stays in your system. Unleash does not ingest or store it. See Connect external metrics for setup instructions.
Source isolation
Internal and external metrics are completely separate in Unleash. Each chart or safeguard is configured against a specific source, and the metric selector labels entries by their source. A metric with the same name can exist in both sources without conflict.
If the external instance is unreachable or returns errors, only charts and safeguards configured against the external source are affected. Internal metrics continue to work normally.
Metric types
Impact metrics support three data types:
- Counters: Cumulative values that only increase, such as request counts, error counts, or event totals.
- Gauges: Values that fluctuate up or down, such as memory usage or the number of active users.
- Histograms: Distributions of values, such as request duration or response size. Unleash calculates percentiles (p50, p95, p99).
Record internal metrics
Internal metrics are currently supported in a select number of SDKs. To request support for additional SDKs, contact beta@getunleash.io.
To use internal metrics, define a metric in the SDK and then record values for it. The SDK automatically attaches the following context labels: appName, environment, and origin (for example, origin=sdk or origin=Edge). These labels are available as filters when you create charts.
Counters
Gauges
Histograms
For language-specific examples, refer to your SDK documentation.
Ingestion and batching
Internal metrics are batched and sent on the same interval as regular SDK metrics. They are ingested through the regular metrics endpoint.
Unleash Edge behavior
Unleash Edge forwards internal metrics received from SDKs to the Unleash API. The origin label appears as origin=Edge. Daisy-chaining Edge instances is not supported.
If an Edge instance accumulates a large batch of metrics due to a temporary network disconnect, it sends them as a single bulk request upon reconnection. This appears as a spike in your counter graphs rather than a smooth distribution over time. This is expected behavior.
Connect external metrics
If you already collect metrics in Prometheus or VictoriaMetrics, you can connect your instance to Unleash and use those metrics in charts and safeguards without re-instrumenting your application through the SDK.
External metrics are not stored in Unleash. Unleash queries your instance at read time when a chart is viewed or a safeguard is evaluated.
Enable external metrics
You can configure external metrics from the Admin UI on both Unleash Hosted and self-hosted instances.
- In the Admin UI, go to Admin settings > Impact Metrics.
- Toggle Enable external metrics to Enabled.
- In Metrics source URL, enter the base URL of your Prometheus or VictoriaMetrics instance.
- Click Test integration to verify that Unleash can reach the endpoint.
- Click Save.
Unleash appends the standard Prometheus HTTP API paths (/api/v1/...) to this base URL, so do not include /api/v1 yourself. A trailing slash is accepted and ignored. Examples:
- Plain Prometheus:
https://prometheus.example.com - VictoriaMetrics cluster or multi-tenant:
https://victoria.example.com/select/<tenantId>/prometheus
The URL must be reachable from the Unleash server over the network. Each request has a 20-second timeout.
HTTP Basic Auth is supported by embedding credentials in the URL (for example, https://user:password@prometheus.example.com). Credentials in URLs can appear in server logs. Use a secrets manager or other secure mechanism if you provision the URL through configuration rather than the Admin UI.
Configure with an environment variable
If you prefer to manage configuration outside the Admin UI on a self-hosted instance, set the EXTERNAL_PROMETHEUS_IMPACT_METRICS_API environment variable on your Unleash server to the base URL of your Prometheus or VictoriaMetrics instance. Unleash must be restarted for changes to take effect.
Metric selector filtering
Prometheus and VictoriaMetrics typically expose many infrastructure metrics that are not relevant as impact metrics. Unleash filters these out of the metric selector.
Excluded metrics
Excluded labels
Unleash excludes the reserved names up, ALERTS, and ALERTS_FOR_STATE, and any metric whose name starts with a well-known infrastructure prefix: go_, process_, prometheus_, promhttp_, scrape_, vm_, vmagent_, vminsert_, vmselect_, container_, kube_, or similar tooling prefixes. If one of your own metrics collides with an excluded prefix, rename it to make it visible.
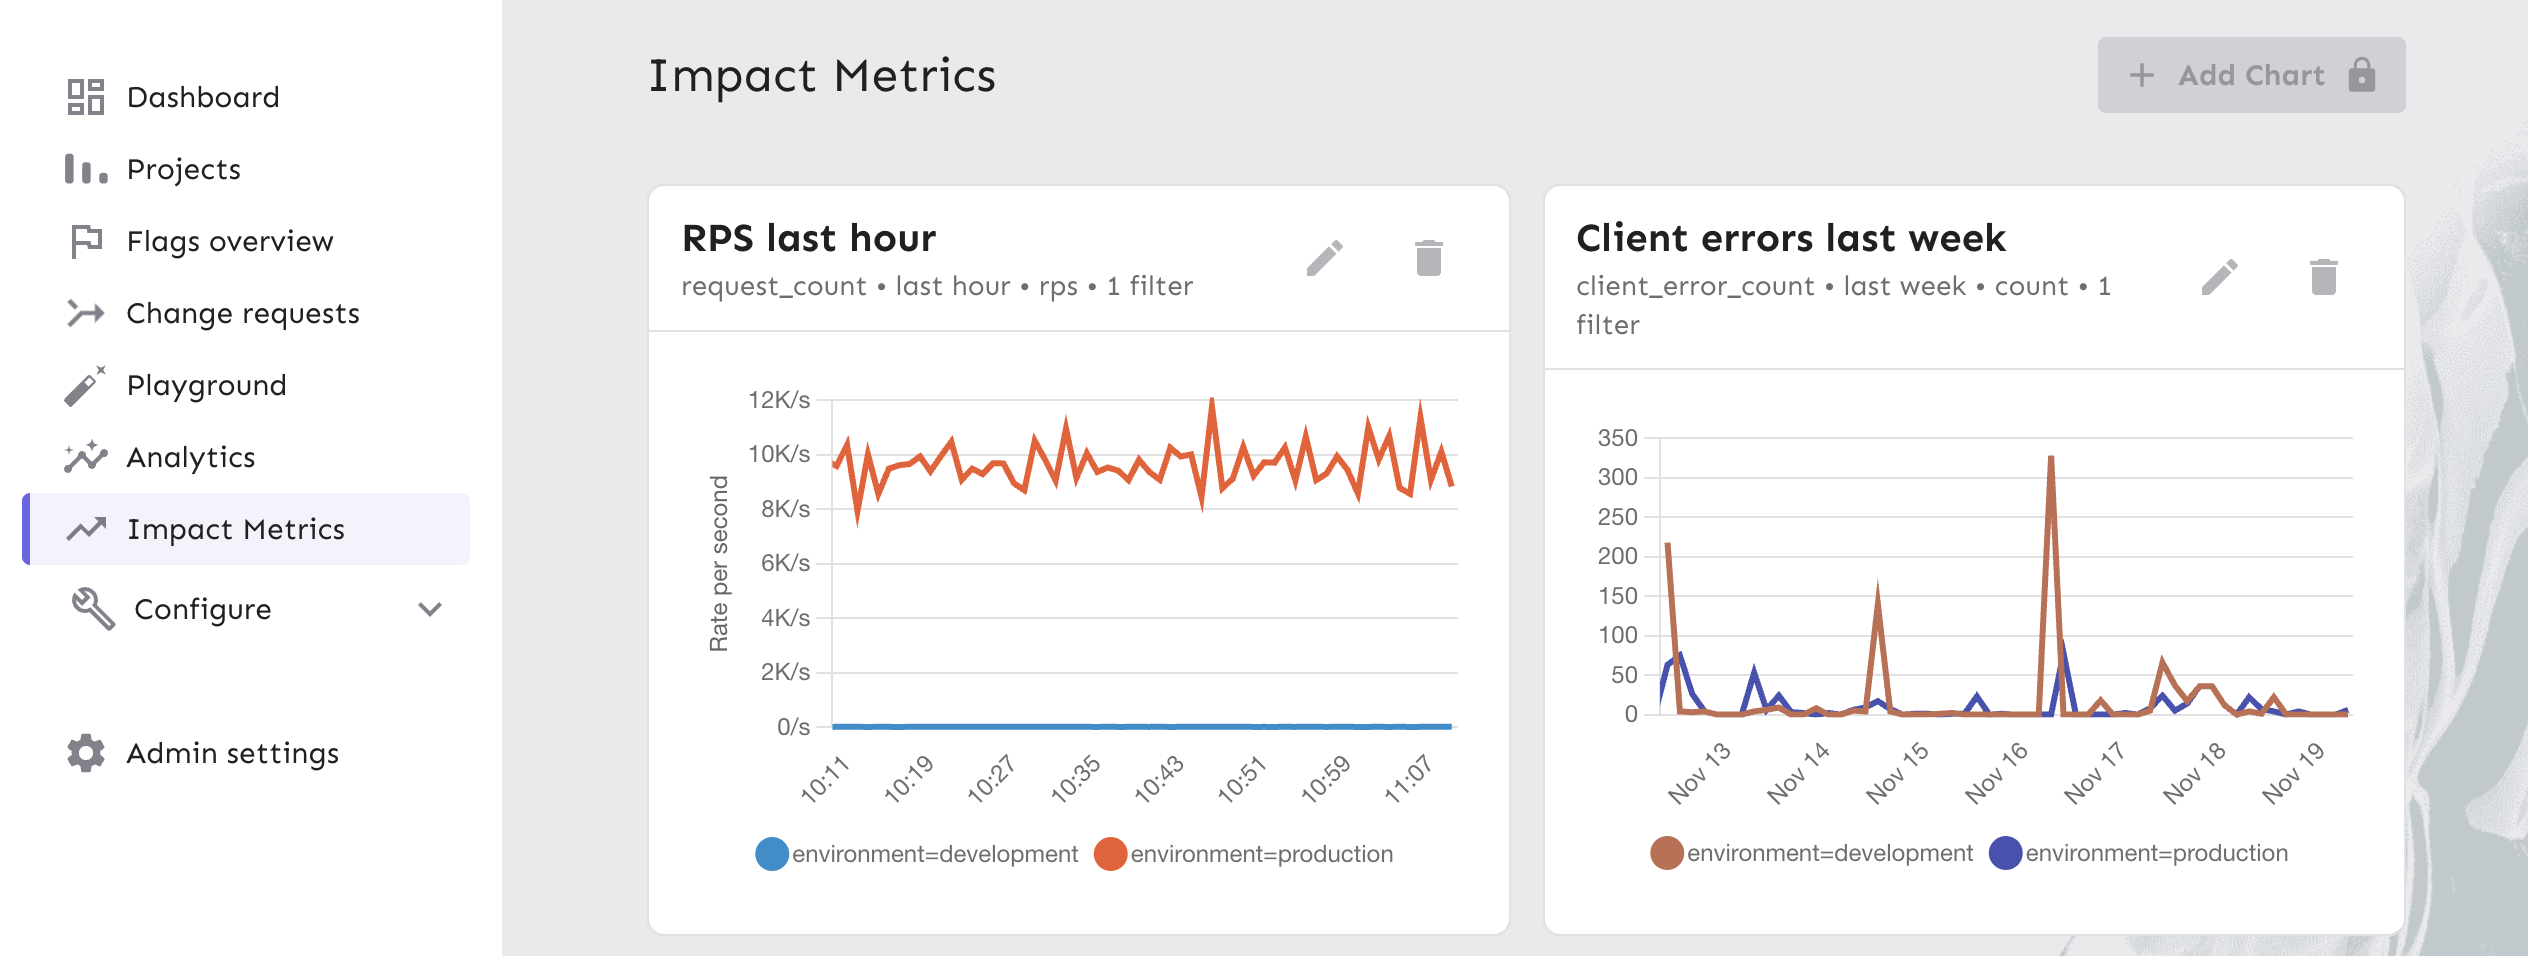
Create charts
You can visualize both internal and external metrics in the Unleash Admin UI.
- Go to Impact Metrics in the sidebar.
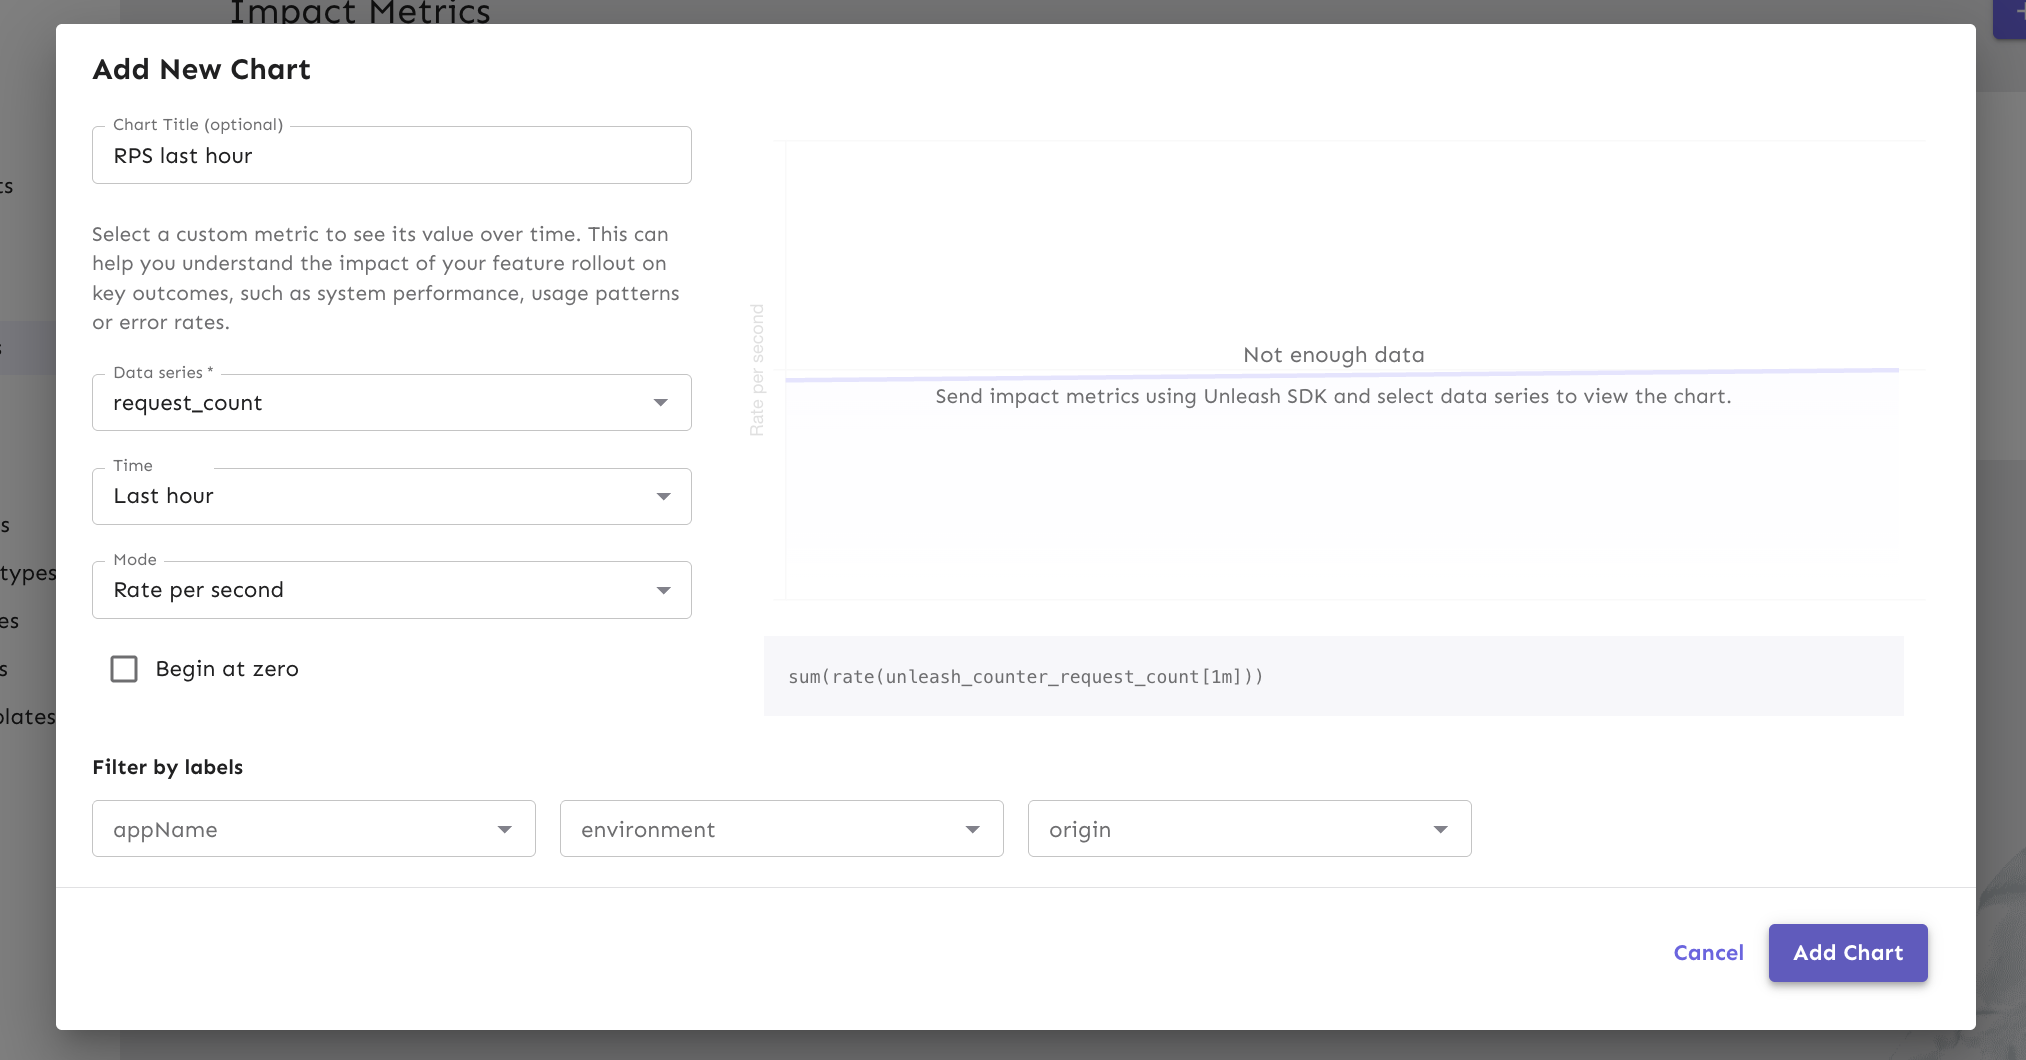
- Click New Chart.
- In the Add New Chart dialog, configure the following:
- Data series: Select a metric. The selector labels each metric with its source (internal or external).
- Time: Select a window (for example, Last 24 hours).
- Mode (aggregation type): Choose how to display the data.
- For counters: Rate per second, Count
- For gauges: Sum, Average
- For histograms: p50, p95, p99
- Filters: For internal metrics, filter by
appName,environment, ororigin. For external metrics, filter by any custom labels exposed by your Prometheus or VictoriaMetrics instance.
- Click Add chart.
There is a 1-2 minute delay between data generation and visualization for internal metrics due to the ingestion cycle. External metrics reflect whatever data is currently available in your Prometheus or VictoriaMetrics instance.
Automate release progression
Impact metrics integrate with release templates to automate the rollout process. Instead of manually advancing milestones, Unleash can progress automatically when time conditions are met.
To configure automatic progression:
- Open a feature flag that uses a release template.
- Select a milestone and click Add automation.
- Define the conditions:
- Time: The minimum duration the milestone must run. For example, proceed after 24 hours.
- Click Save.
When the time conditions are satisfied, Unleash advances the release to the next milestone.
Configure safeguards
Safeguards automatically react when an impact metric crosses a threshold. You can configure safeguards against both internal and external metrics.
Safeguards are attached to a feature flag’s environment, so you can react differently in development, staging, and production using the same metric.
Safeguard actions
When you add a safeguard, you choose an action that runs if the metric crosses the threshold:
- Disable environment: Turns the flag off in this environment in Unleash. Connected SDKs and the Frontend API pick up the change on their next refresh interval, so it is not an instant client-side cut-off.
- Pause release plan automation: Stops automatic milestone progression. The current milestone keeps serving traffic, and you can investigate before manually resuming. This action only applies if the flag has an active release plan in the environment.
Add a safeguard
Before you start, verify that your metric is available by selecting Add safeguard and checking the dropdown. For internal metrics, it may take up to 60 seconds for a new metric to appear because the SDK sends metrics on a default 60-second interval.
To add a safeguard to an environment:
- Open the feature flag and locate the environment you want to protect.
- Click Add safeguard and select the action: Disable environment or Pause release plan automation.
- Select your impact metric from the dropdown. The selector labels each metric with its source.
- Configure the threshold. For example:
- Metric:
analyze_feature_error - Aggregated by: Count
- Condition: More than 10 in the last 15 minutes
- Metric:
- Click Save.
When the metric crosses the threshold, Unleash runs the configured action for that environment.
External metrics safeguard behavior
Safeguards work the same way for both internal and external metrics, with the following differences for external metrics:
- Environment scoping: To scope an external metric to a specific Unleash environment, add an
environmentlabel to the metric whose value matches the environment name (for example,environment="production"). The safeguard then only evaluates time series with that label. If theenvironmentlabel is missing, the metric is available in every environment with no per-environment filtering. - No custom-label filtering: Safeguards against external metrics evaluate the metric across all time series. You cannot filter by custom labels. If you need a narrower scope, expose a dedicated metric in your Prometheus or VictoriaMetrics instance with the scope already applied.
- Missing configuration: If the external URL is not configured (for example, the environment variable is unset), safeguards configured against the external source are skipped rather than failing the release. Reconfiguring the URL restores them.
Load on your external metrics backend
Connecting an external instance adds read load to your Prometheus or VictoriaMetrics, similar to Grafana or other query-time tools. Plan capacity accordingly as the number of charts and active safeguards grows.
Unleash issues the following Prometheus HTTP API requests:
Metadata requests run when you open the chart or safeguard configuration UI. Range queries run when charts are viewed and each time a safeguard is evaluated.